A QR code
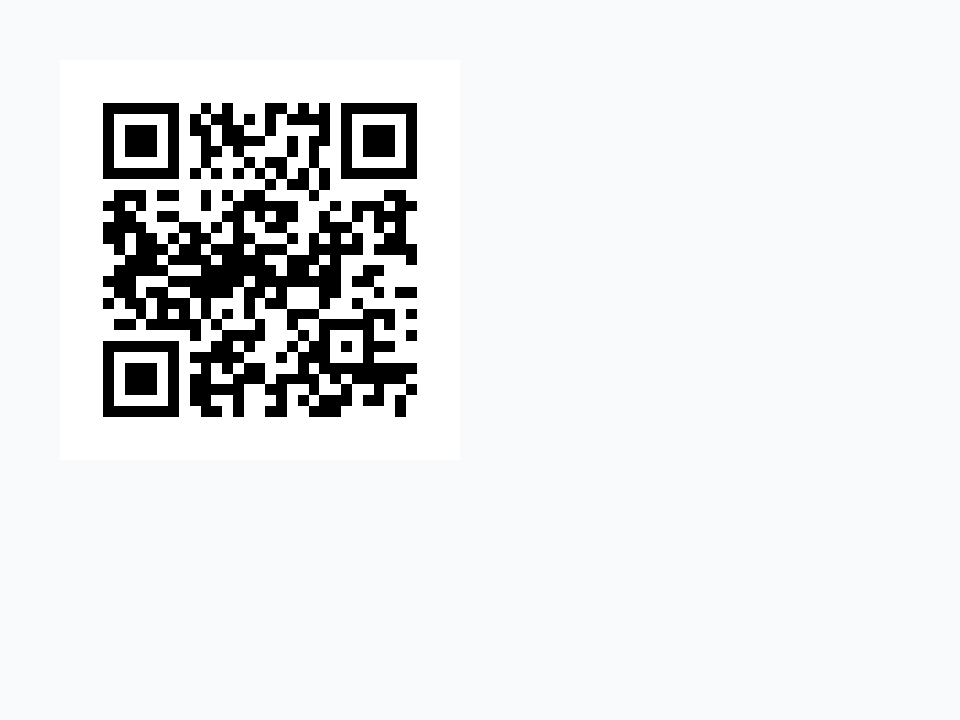
A QR code is the square of black and white dots that a phone's camera reads as a web address, a Wi-Fi password or any short text. The QR library makes one in an image: qrCreate takes the image's name, the text, how much error correction to build in, and the size of each dot in pixels:
create image "Code"
qrCreate "Code", "https://openxtalk.org", "M", 4
put the result into tInfo
set the topLeft of image "Code" to 20, 20
put "version" && item 1 of tInfo
put the width of image "Code" & "x" & the height of image "Code"version 2 132x132
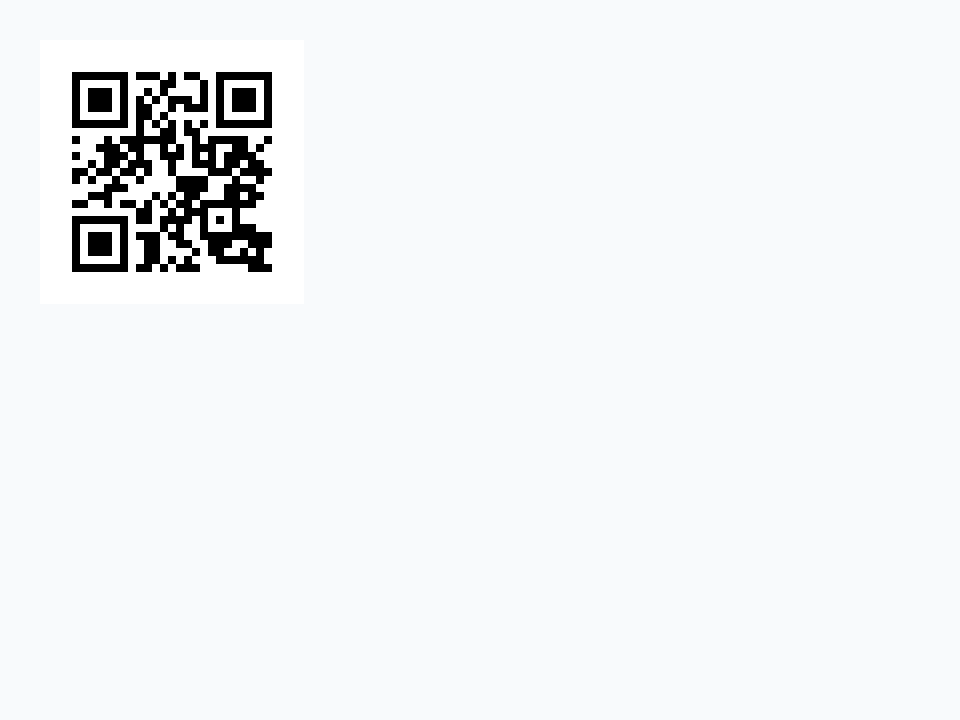
Point a phone at the picture and it offers to open the address. the result says how the code came out: its first item is its version, from 1, the smallest at 21 by 21 dots, to 40. The library picks the smallest version the text fits in, and the white border around the dots, the quiet zone, is part of the code: scanners need it.
The image can just as well be one you drag from the Tools palette and name in the Property Inspector: qrCreate sets the picture of whatever image it is given. The examples here make theirs with create image (Making controls from a script), so that each runs on an empty card.
Error correction
A code can still be read with part of it dirty, torn or covered by a logo, because it repeats what it holds. The four levels say how much it can lose: L about 7%, M 15%, Q 25% and H 30%. More correction means more dots, so a bigger version. Giving ! as the image's name makes no image, only the result:
repeat for each item tLevel in "L,M,Q,H"
   qrCreate "!", "https://openxtalk.org/lessons/qr-codes-drawings/", tLevel, 1
   put tLevel && "version" && item 1 of line 1 of the result
end repeatL version 3 M version 4 Q version 5 H version 6
M suits a screen; a code printed on a box or a poster, which may get scuffed, is better at Q or H. And shorter text makes a smaller code that is easier to scan from far away, so a short address is worth having.
Colours and files
qrSetColors sets the colours of the codes made after it, the dots first and then the background. Keep the dots darker than the background, and the two far apart, or scanners give up:
qrSetColors "20,40,110", "255,248,220"
create image "Code"
qrCreate "Code", "https://openxtalk.org", "Q", 4
put the result into tInfo
set the topLeft of image "Code" to 20, 20
qrSetColors "black", "white"
put "error correction" && item 2 of tInfoerror correction Q
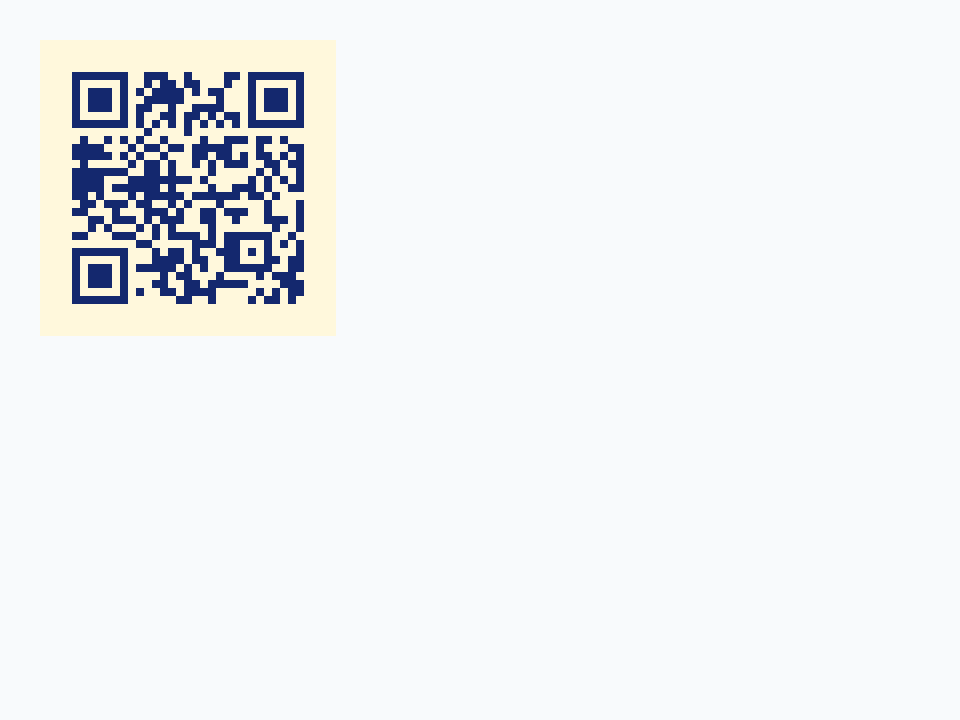
The colours stay set until changed, so the last line puts them back for the next code. With !, the lines after the first line of the result are a PNG file's bytes, ready to save, to send to a web page, or to put in an email:
qrCreate "!", "https://openxtalk.org", "M", 8
put the result into tResult
put line 2 to -1 of tResult into tPng
put byte 2 to 4 of tPng
put specialFolderPath("temporary") & "/openxtalk-qr.png" into tFile
put tPng into URL ("binfile:" & tFile)
put there is a file tFile
delete file tFilePNG true
Every PNG file starts with the bytes PNG after its first, which is how a program can tell one.
An SVG drawing
SVG is the usual way to give a picture as shapes rather than dots: a circle at this centre with this radius, a line from here to there. Because it is shapes, it is sharp at any size. The Drawing library compiles SVG into a drawing, which an image shows when you set its text to it, as it shows a PNG. It reads the SVG with the XML external, so that must be loaded too, as it is in the IDE:
put "<svg xmlns='http://www.w3.org/2000/svg' viewBox='0 0 100 100'>" & \
      "<circle cx='50' cy='50' r='38' fill='gold' stroke='darkorange' stroke-width='8'/>" & \
      "</svg>" into tSvg
put drawingSvgCompile(tSvg) into tSun
put the result is empty
create image "Small"
set the text of it to tSun
set the rect of it to 20, 20, 80, 80
create image "Big"
set the text of it to tSun
set the rect of it to 100, 20, 280, 200true
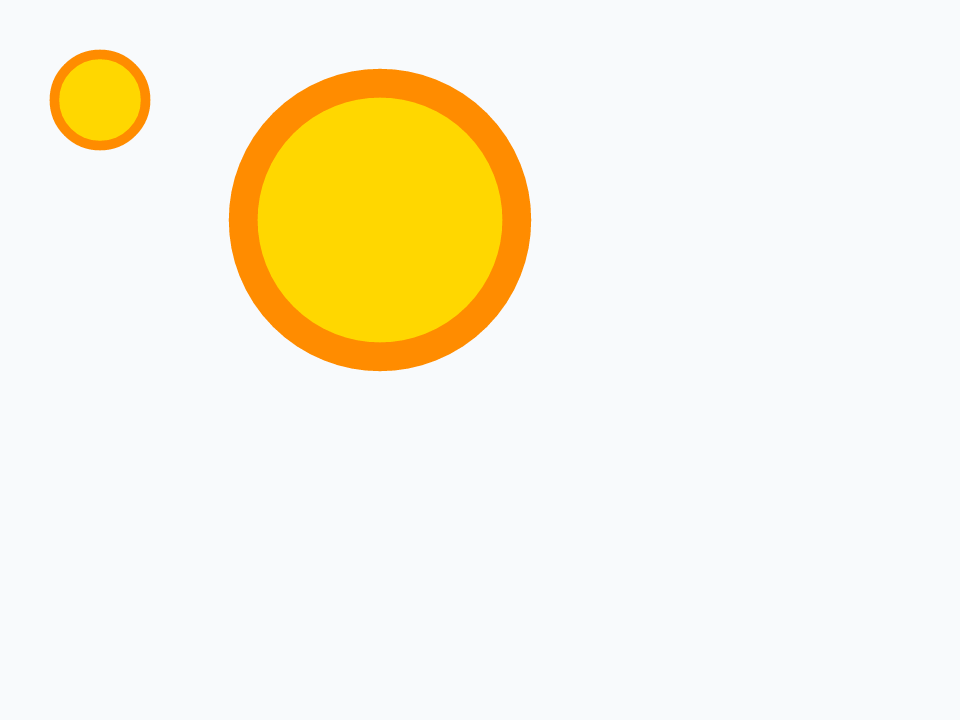
the result is empty, so nothing went wrong; it would say what did. The SVG's viewBox says its own coordinates run from 0 to 100, and setting an image's text sizes it to that, 100 by 100 pixels, so the size comes after. The drawing scales to fill each image, so the big sun is as crisp as the small one, where a PNG made bigger goes blurry. drawingSvgCompileFile does the same with an .svg file's path, and File > Import as Control > Image File takes an SVG file straight into an image.
Reading a drawing back
A drawing is not a black box. drawingDecode gives back its size and its shapes, each an array with its type, its geometry and its paint:
put "<svg xmlns='http://www.w3.org/2000/svg' viewBox='0 0 100 100'>" & \
      "<rect x='10' y='40' width='80' height='50' fill='#4682b4'/>" & \
      "<polygon points='5,45 50,10 95,45' fill='firebrick'/>" & \
      "</svg>" into tSvg
put drawingDecode(drawingSvgCompile(tSvg)) into tHouse
put tHouse["width"] && tHouse["height"]
put the number of elements in tHouse["shapes"]
put tHouse["shapes"][1]["type"] && tHouse["shapes"][1]["width"] && tHouse["shapes"][1]["height"]
put tHouse["shapes"][2]["type"] && tHouse["shapes"][2]["points"]
put tHouse["shapes"][2]["fill"]["color"]100 100 2 rect 80 50 polygon 5,45 50,10 95,45 0.698,0.1333,0.1333,1
A colour is red, green, blue and opacity, each from 0 to 1. drawingSvgDecompile goes the other way, from a drawing to SVG text again, so a program can save a drawing for other programs to open.
Drawings into graphics
drawingFlatten turns every shape into the points of a polygon, with curves made of short straight lines no further than its second parameter from the true curve. Those points are what a polygon graphic holds, so a drawing can become graphics you can then move, colour and edit like any other (the IDE's Convert to Graphics does this):
put "<svg xmlns='http://www.w3.org/2000/svg' viewBox='0 0 100 100'>" & \
      "<rect x='10' y='40' width='80' height='50' fill='#4682b4'/>" & \
      "<polygon points='5,45 50,10 95,45' fill='firebrick'/>" & \
      "</svg>" into tSvg
put drawingFlatten(drawingSvgCompile(tSvg), 0.5) into tFlat
put 0 into tCount
repeat for each element tShape in tFlat["shapes"]
   add 1 to tCount
   create graphic ("Part" && tCount)
   set the style of it to "polygon"
   set the filled of it to true
   set the points of it to tShape["points"]
   put tShape["fill"]["color"] into tColour
   set the backColor of it to round(item 1 of tColour * 255), \
         round(item 2 of tColour * 255), round(item 3 of tColour * 255)
   set the rect of it to (the left of it * 2 + 40), (the top of it * 2 + 20), \
         (the right of it * 2 + 40), (the bottom of it * 2 + 20)
end repeat
put the number of graphics
put the number of lines in the points of graphic "Part 2"2 4
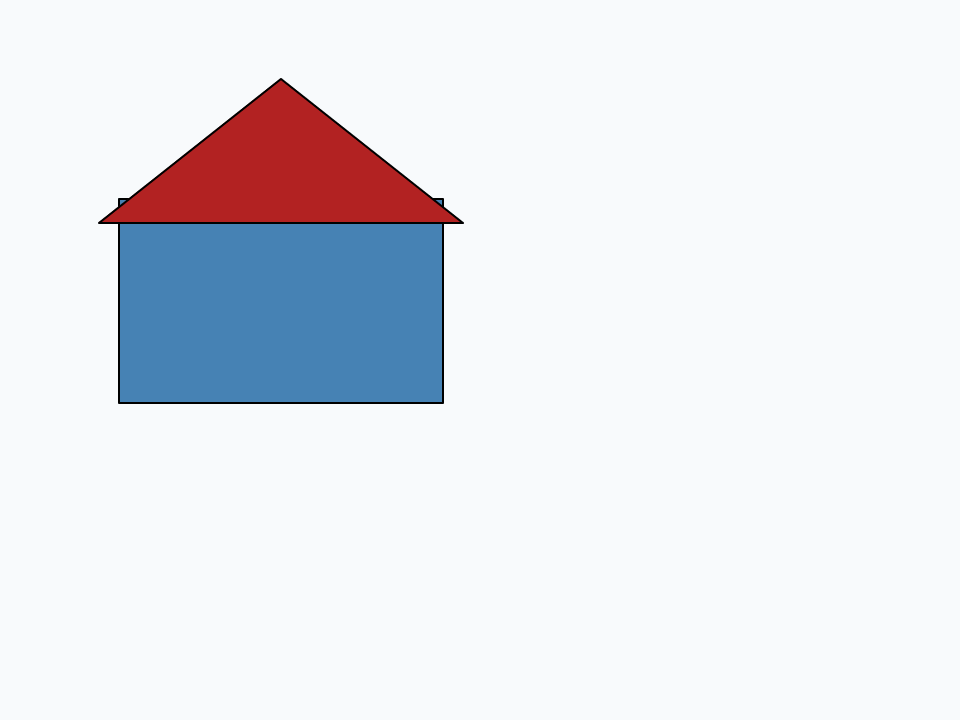
The points come in the drawing's own units, 0 to 100 here, so the last line inside the loop doubles each graphic and moves it in from the corner. A rectangle and a triangle have no curves to flatten; a circle would have become many short lines.
Try it yourself
Write a command showQR that takes some text and an image's name, makes the code at error correction Q, and sets the image's size to 200 by 200 pixels whatever the version, keeping its top left where it was. Remember that the quiet zone is part of the code.
Show a solution
command showQR pText, pImage
   local tTopLeft
   put the topLeft of image pImage into tTopLeft
   qrCreate pImage, pText, "Q", 1
   set the width of image pImage to 200
   set the height of image pImage to 200
   set the topLeft of image pImage to tTopLeft
end showQR

create image "Ticket"
set the topLeft of it to 30, 30
showQR "Seat 14C, the 8:15 to Lyon", "Ticket"
put the rect of image "Ticket"30,30,230,230
Making it at a dot size of 1 and then stretching the image keeps the dots square only when 200 is a whole multiple of the code's width; for a sharp code at any size, choose the dot size that comes nearest instead.
Words in this lesson
qrCreateqrSetColorsdrawingSvgCompiledrawingSvgCompileFiledrawingDecodedrawingSvgDecompiledrawingFlattenthe text of imagethe pointsEach one finds every lesson that uses it. The Dictionary has the whole story of each, with its syntax and more examples.