Shapes
A graphic is a shape the engine draws: it stays sharp at any size, and you can change it at any time by setting its properties. The Shapes section of the Tools palette has a tile for each kind, from a Rectangle Graphic to a Five Point Star Graphic. Whichever you drag, its style is one of rectangle, roundRect, oval, line, polygon, curve and regular (a regular polygon), and the Inspector's Basic section has the properties of that style.
- On a new card, drag four shapes into a row, each about 100 points square: a Round Rectangle Graphic named
Rounded, a Regular Polygon Graphic namedHex, an Oval Graphic namedPie, and another Regular Polygon Graphic namedTriangle. - In the Property Inspector's Basic section, set the Corner radius of
Roundedto 24, the Sides ofHexto 6 and ofTriangleto 3, and the Arc ofPieto 270. - Give each a Fill color: violet, teal, gold and orange.
put the style of graphic "Hex"
put the polySides of graphic "Hex"
put the arcAngle of graphic "Pie"
put the number of graphicsregular 6 270 4
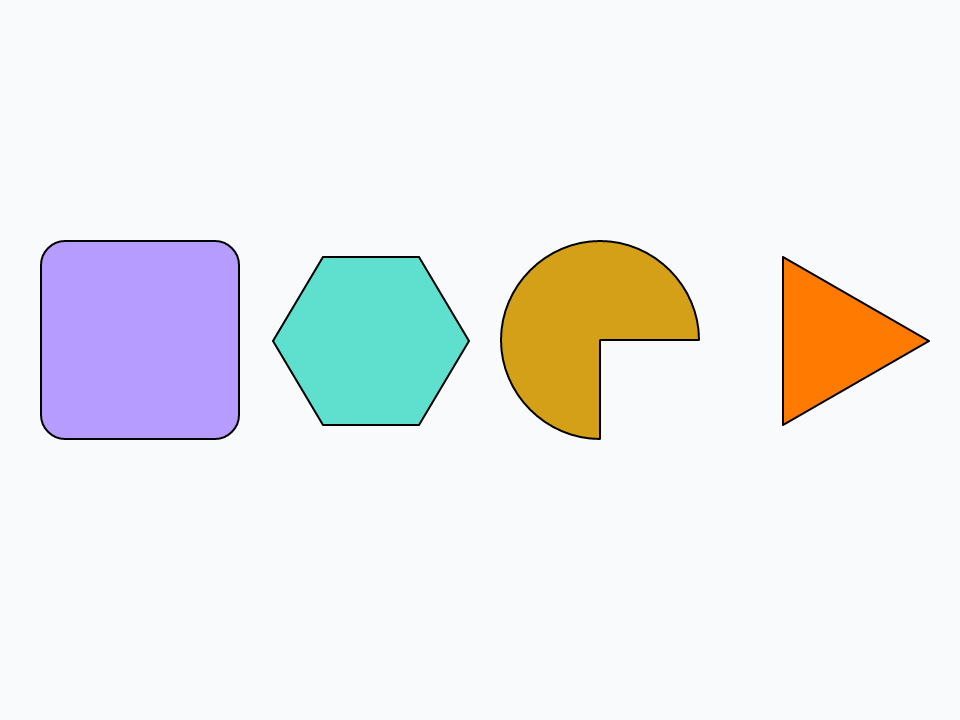
A shape is filled with its backgroundColor when its filled (or opaque: they are the same property) is true, as it is for the palette's shapes, and drawn round with its foregroundColor at its lineSize (Line thickness). Set the lineSize to 0 for a shape with no outline.
Lines, polygons and points
A line or polygon is a list of points, one x,y a line, which the Inspector shows in its Points box. A line can have an arrowhead at either end (Start arrow and End arrow):
- On a new card, drag a Line Graphic and name it
Arrow. - In the Property Inspector's Basic section, set its Line thickness to 6 and tick End arrow.
set the points of graphic "Arrow" to "60,180" & return & "420,180"
put the style of graphic "Arrow"
put the points of graphic "Arrow"line 60,180 420,180
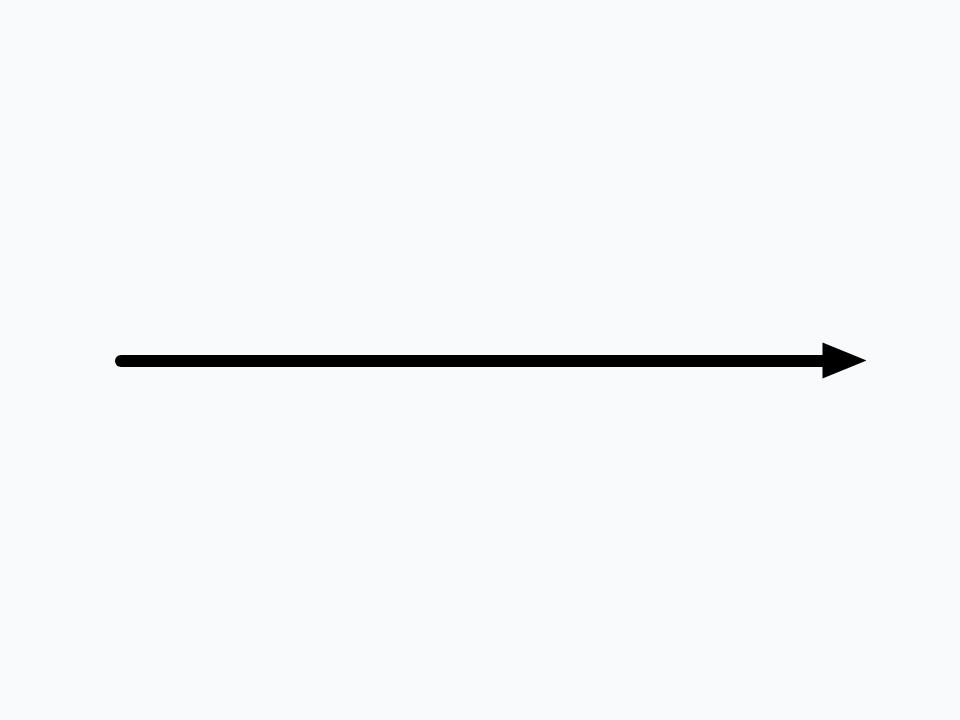
Setting the points moved the arrow and stretched it to run between them. Points are numbers, so a script can work them out. Here a little trigonometry from Math functions places the ten corners of a star, and turns a palette shape into it:
- On a new card, drag any shape, a Regular Polygon Graphic say, and name it
Star. Give it a pale yellow Fill color. - Drag a Standard Button to a corner and name it
Draw.
on mouseUp
   repeat with i = 0 to 9
      if i mod 2 is 0 then
         put 140 into tRadius
      else
         put 56 into tRadius
      end if
      put round(240 + tRadius * sin(i * pi / 5)) & comma & \
            round(190 - tRadius * cos(i * pi / 5)) & return after tPoints
   end repeat
   put line 1 of tPoints after tPoints
   set the style of graphic "Star" to "polygon"
   set the points of graphic "Star" to tPoints
   put the number of lines of the points of graphic "Star"
end mouseUp11

The last point repeats the first, which closes the shape. (For a star by hand, the palette's Five Point Star Graphic is a polygon with its points already in place.)
Gradients and see-through colours
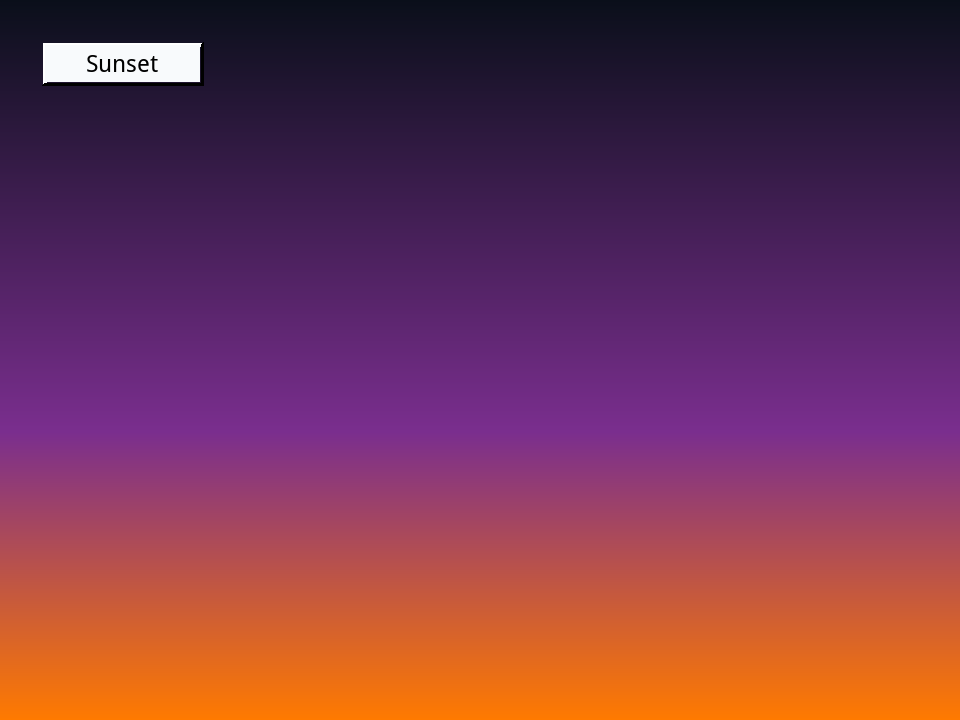
A graphic can be filled with a gradient instead of one colour: in the Inspector, Fill gradient in the Colors section opens a gradient editor. In xTalk, its fillGradient is an array: the type (linear, radial and others), the ramp of colours, each line a position from 0 to 1 followed by red, green and blue, and the points it runs from and to, with via giving its other direction.
- On a new card, drag a Rectangle Graphic, name it
Sky, and make it cover the whole card. Set its Line thickness to 0. - Drag a Standard Button onto it and name it
Sunset.
on mouseUp
   put "linear" into tGradient["type"]
   put "0.0,10,15,26" & return & "0.6,122,46,142" & return & "1.0,255,122,0" into tGradient["ramp"]
   put "240,0" into tGradient["from"]
   put "240,360" into tGradient["to"]
   put "480,0" into tGradient["via"]
   set the fillGradient of graphic "Sky" to tGradient
   put the fillGradient["type"] of graphic "Sky"
end mouseUplinear
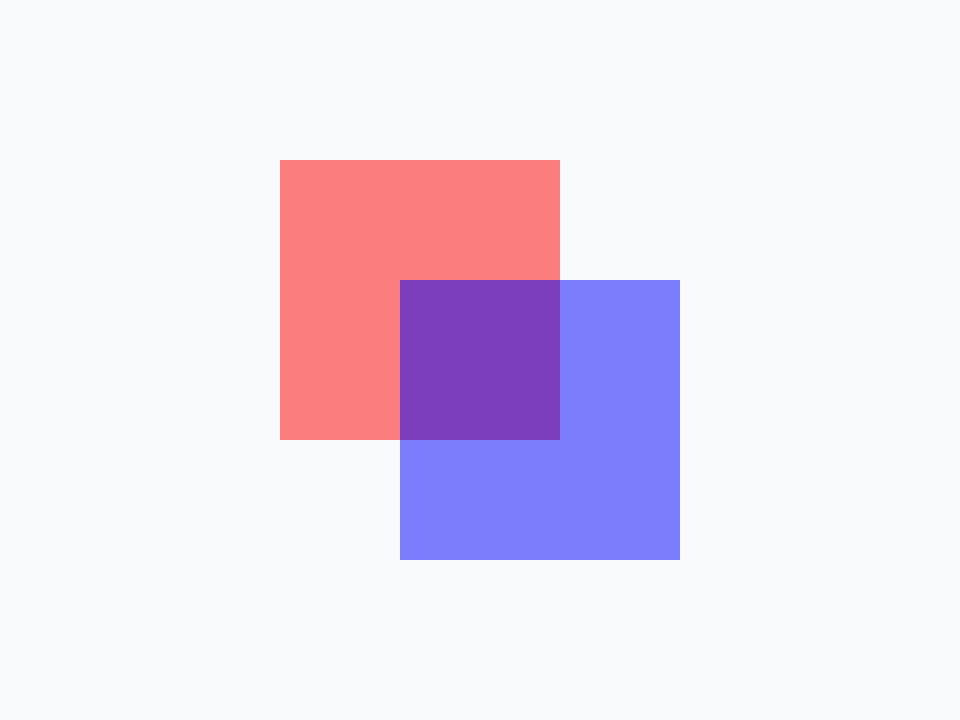
The blendLevel of any control (Blend level, in the Inspector's Colors) makes it see-through: 0 is solid, 100 invisible.
- On a new card, drag two Rectangle Graphics, about 140 points square, so that they overlap. Name them
RedandBlue, fill them red and blue, and set the Line thickness of each to 0.
set the blendLevel of graphic "Red" to 50
set the blendLevel of graphic "Blue" to 50
put the blendLevel of graphic "Blue"50
Images
An image holds pixels: a photo, an icon, a drawing. You usually bring one in with File > Import As Control > Image File, or drag an Image from the palette and choose its file as its Source in the Inspector (the filename property). An image is also something to paint on: with an empty one selected, the palette's Paint Tools draw into it, and a script can paint it too. Its imageData is four bytes for every pixel, row by row, the last three of each being red, green and blue.
- On a new card, drag an Image to the middle, name it
Pixels, and in the Property Inspector's Position section set its Width and Height to 128. - Drag a Standard Button to a corner and name it
Paint.
on mouseUp
   repeat with y = 0 to 127
      repeat with x = 0 to 127
         put numToByte(0) & numToByte(x * 2) & numToByte(y * 2) & numToByte(160) after tData
      end repeat
   end repeat
   set the imageData of image "Pixels" to tData
   put the number of bytes of the imageData of image "Pixels"
end mouseUp65536
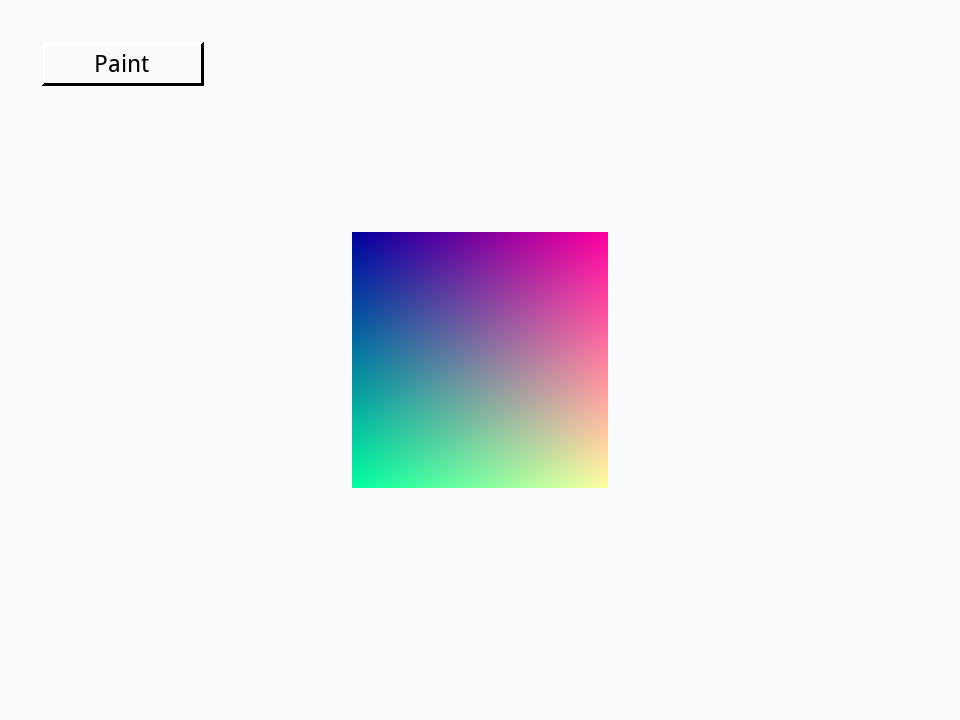
That is 128 times 128 pixels, at four bytes each. Each pixel's red grows from left to right and its green from top to bottom, so the corners show the four mixes.
Try it yourself
Build a traffic light with the palette: a tall dark grey Round Rectangle Graphic named Box, with three Oval Graphics in it named Lamp 1, Lamp 2 and Lamp 3, red, amber and green from the top. Then add a Standard Button named Next whose script lights one lamp at a time, in turn: the lit lamp has a blendLevel of 0, and the others of 80.
- Drag a Round Rectangle Graphic, about 100 points wide and 320 high, name it
Box, set its Corner radius to 30 and its Fill color to dark grey. - Drag three Oval Graphics into it, each 70 points across, and name them
Lamp 1,Lamp 2andLamp 3from the top. Fill them red, orange and green. - Drag a Standard Button beside it and name it
Next.
Show a solution
on mouseUp
   repeat with i = 1 to 3
      if the blendLevel of graphic ("Lamp" && i) is 0 then put i into tLit
   end repeat
   put tLit mod 3 + 1 into tNext
   repeat with i = 1 to 3
      set the blendLevel of graphic ("Lamp" && i) to 80
   end repeat
   set the blendLevel of graphic ("Lamp" && tNext) to 0
   put "Lamp" && tNext && "is lit"
end mouseUpLamp 1 is lit Lamp 2 is lit Lamp 3 is lit
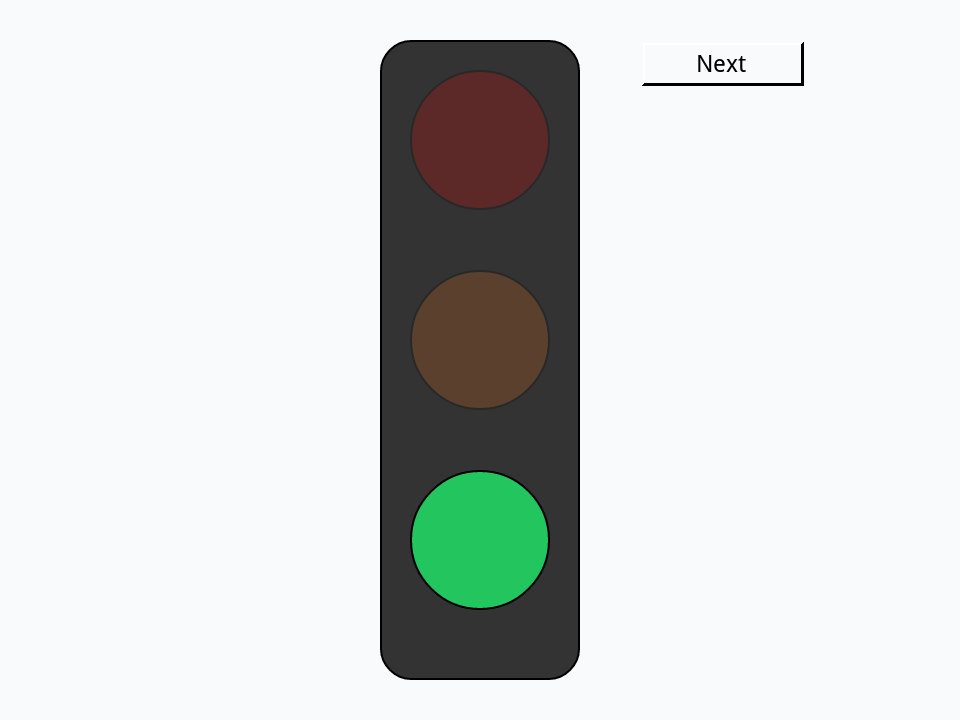
At first every lamp has a blendLevel of 0, so the loop finds the last one, and the first click lights Lamp 1. After Lamp 3, mod brings it back round to 1.
Words in this lesson
graphicstylepointspolySidesroundRadiusarcAnglelineSizefilledopaquefillGradientendArrowblendLevelimageimageDataShapesEach one finds every lesson that uses it. The Dictionary has the whole story of each, with its syntax and more examples.