A line graph
A column of numbers says little at a glance; a line that climbs and falls says it at once. The Line Graph widget draws one or more lines from its graphData: a line of text for each point along the bottom, its label first and then a value for each line of the graph, separated by commas. It works out the scale and labels its axes itself:
put "Mon,24,9" & return & "Tue,26,11" & return & "Wed,27,8" & return & "Thu,25,12" & return & \
      "Fri,29,14" & return & "Sat,31,13" & return & "Sun,30,10" into tWeek
create widget "Week" as "com.livecode.widget.linegraph"
set the rect of it to 20, 20, 460, 340
set the graphData of it to tWeek
set the graphColors of it to "214,40,57,255" & return & "40,110,200,255"
put the number of lines of the graphData of widget "Week"
put item 2 of line 6 of the graphData of widget "Week"7 31
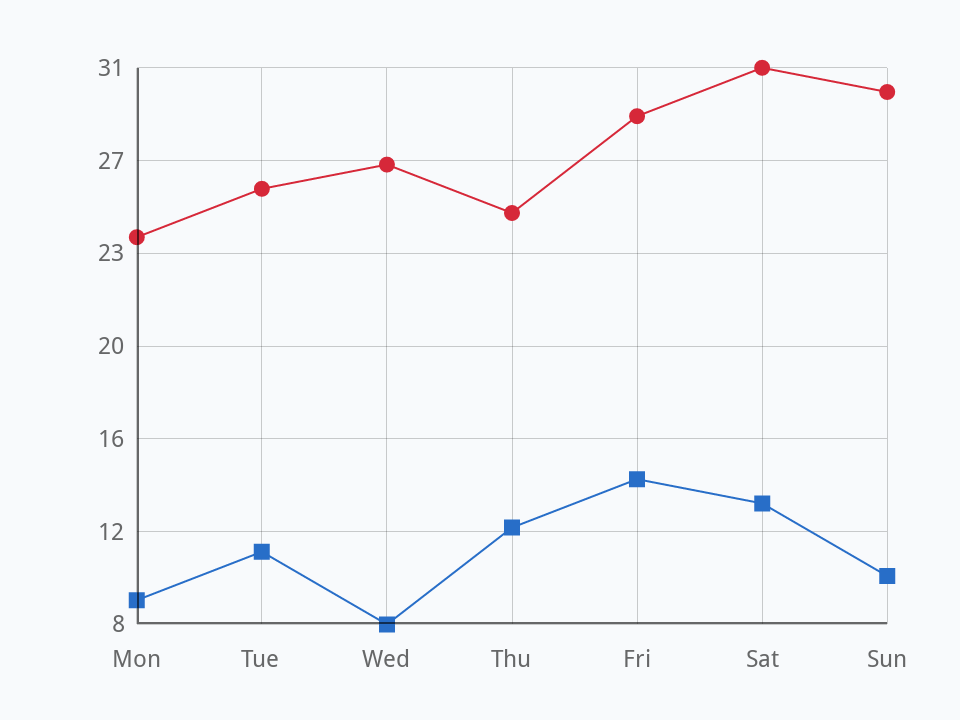
Here the first value of each day is Madrid's temperature and the second Oslo's. graphColors gives each line its colour, a line of text each, as red, green, blue and opacity; markerStyles gives each its dots, a line each too, such as filled circle, square or the name of an icon, or none at all when it is empty. It starts as filled circle, filled square and filled diamond, which is why Oslo has squares.
The side runs from the smallest value to the largest, in as many steps as there are points along the bottom, and each label is rounded to a whole number: seven days make six steps from 8 to 31, so the labels are 8, 12, 16, 20 and so on.
The data can come from a calculation as well as a list. Savings of 1000 that grow by 5% a year are worth 1000 times 1.05 to the power of the number of years, 1000 * 1.05 ^ tYear. Here they are every second year for twenty years, with one point marked by hilitedCoordinates, which draws a dot there and dashed lines to the axes:
put empty into tData
repeat with tYear = 0 to 20 step 2
   put tYear & comma & round(1000 * 1.05 ^ tYear) & return after tData
end repeat
create widget "Savings" as "com.livecode.widget.linegraph"
set the rect of it to 20, 20, 460, 340
set the graphData of it to line 1 to -1 of tData
set the graphColors of it to "30,150,90,255"
set the markerStyles of it to empty
set the hilitedCoordinates of it to "10," & item 2 of line 6 of tData
put the hilitedCoordinates of widget "Savings"10,1629
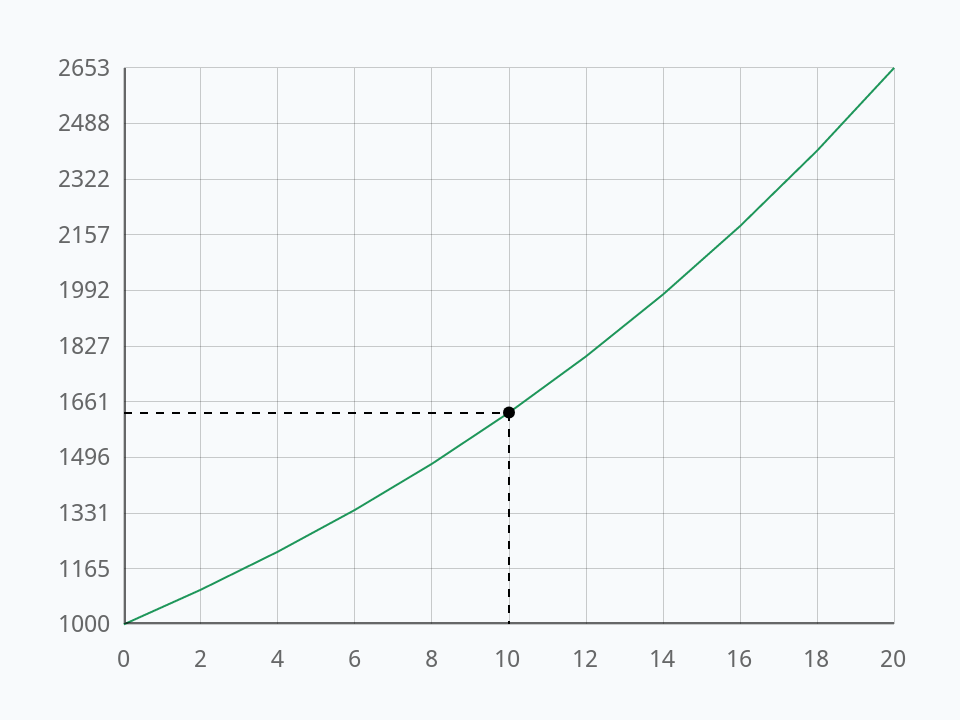
Line 6 of the data is year 10, because the years start at 0 and go up in twos. After ten years the money has grown by more than half, and after twenty it has more than doubled: the line curves up because each year's growth is on a bigger sum.
A pie chart
A Pie Chart shows how a whole is shared out. Build a card with one:
- Make a new stack, or go to an empty card. In Edit mode, drag a Pie Chart from the widgets of the Tools palette to the left of the card, make it about 260 pixels square, and name it
Budget. - Drag a classic Field to the right of it and name it
Info.
Its sectorValues are the sizes of the slices, and it works out each one's share of the whole; its sectorLabels name them, and its sectorColors colour them, a line each:
set the sectorValues of widget "Budget" to "900,450,250,150"
set the sectorLabels of widget "Budget" to "Rent,Food,Travel,Fun"
set the sectorColors of widget "Budget" to "52,120,200" & return & "235,140,40" & return & "60,160,110" & return & "150,80,190"
put the sectorLabels of widget "Budget"Rent,Food,Travel,Fun
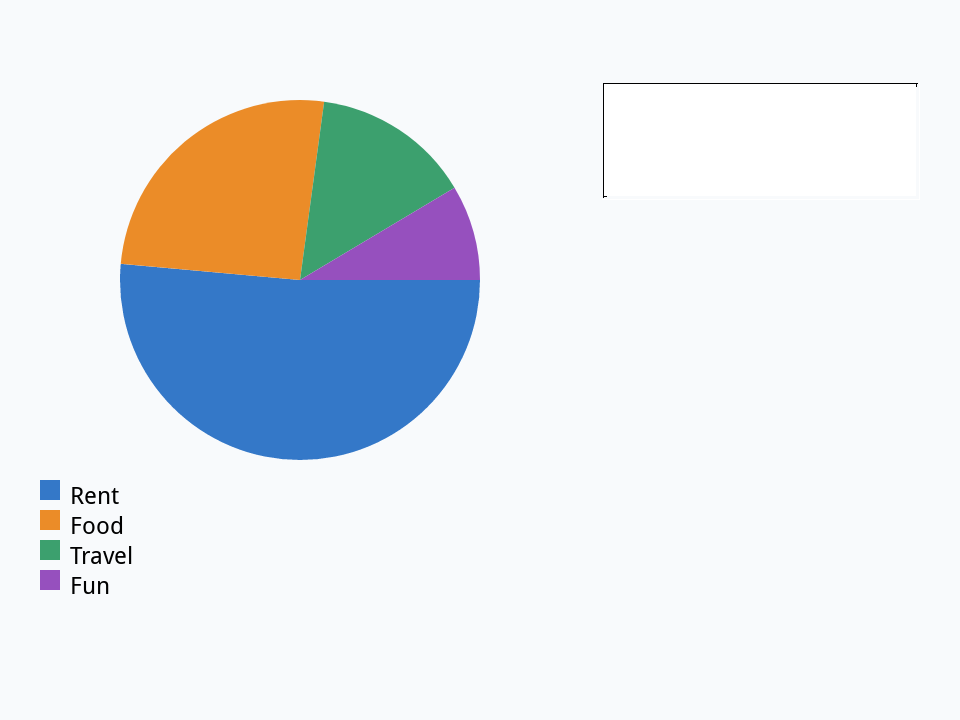
A click on a slice sends sectorClicked with the slice's number. Put this in the Pie Chart's script, to say what share of the whole a slice is:
on sectorClicked pSector
   local tValues, tTotal, tValue
   put the sectorValues of me into tValues
   put 0 into tTotal
   repeat for each item tValue in tValues
      add tValue to tTotal
   end repeat
   put item pSector of the sectorLabels of me & ":" && \
         round(item pSector of tValues / tTotal * 100) & "%" into field "Info"
end sectorClicked
Click a slice in Run mode, or send the message from the Message Box, with the slice's number after its name:
set the sectorValues of widget "Budget" to "900,450,250,150"
set the sectorLabels of widget "Budget" to "Rent,Food,Travel,Fun"
send "sectorClicked 2" to widget "Budget"
put field "Info"Food: 26%
A clock
The Clock widget is a clock face with hands that move, and a darker face at night, from eight in the evening until six in the morning. It shows the computer's own time unless its timeZone is set, to the seconds that zone is ahead of UTC. The Time Zone library (Time zones) knows that number for every city, summer time included, so a wall of clocks for the world takes a few lines:
put 1768478400 into tMoment -- 12:00 UTC on 15 January 2026
put 20 into tLeft
repeat for each item tZone in "Europe/London,Asia/Tokyo,America/New_York"
   create widget tZone as "com.livecode.widget.clock"
   set the rect of it to tLeft, 40, tLeft + 130, 170
   set the timeZone of it to FromUniversalTime(tMoment, tZone) - tMoment
   add 150 to tLeft
end repeat
put the timeZone of widget "Asia/Tokyo"
put the timeZone of widget "America/New_York" / 360032400 -5
A real world clock would use the seconds for the moment, and set the offsets again now and then, since they change with summer time. The hands move by themselves; the page shows no picture of them because they would be at a different time each time it was checked.
A calendar
The Calendar widget shows a month, with arrows to go to the one before or after, and lets people choose a day with a click, which sends dateChanged with that day. Its selectedDate is the chosen day, written year, month and day, 2024-02-14, which sorts and compares correctly as text and is how databases write dates too. Setting it shows that day's month:
create widget "Date" as "com.livecode.widget.calendar"
set the rect of it to 20, 20, 300, 300
set the selectedDate of it to "2024-02-14"
put the selectedDate of widget "Date"
set the itemDelimiter to "-"
put item 2 of the selectedDate of widget "Date"2024-02-14 02
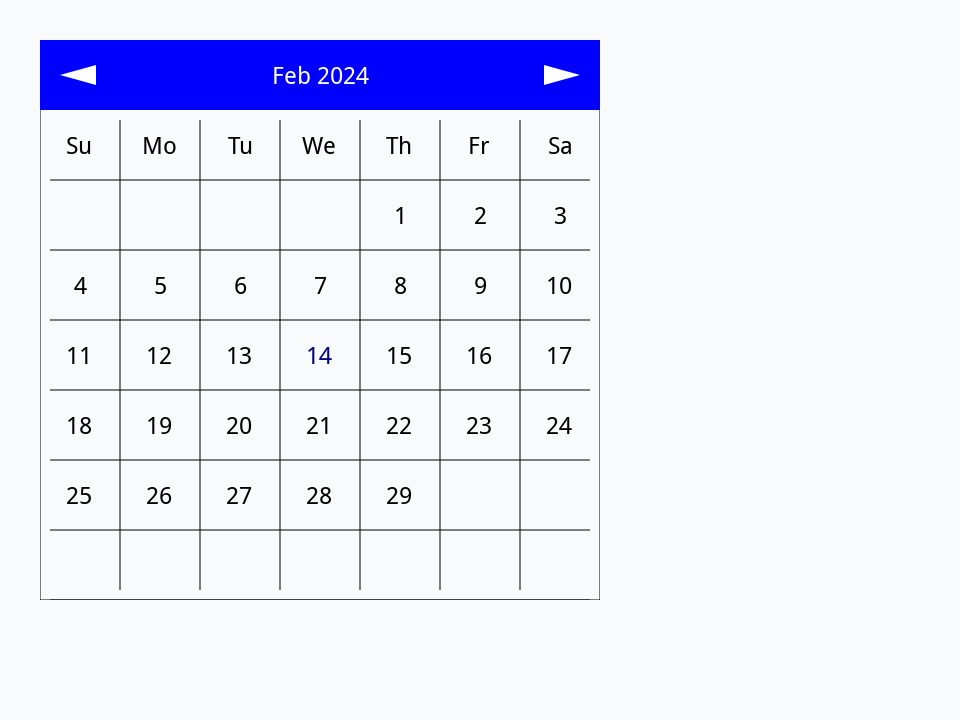
A handler of dateChanged in the Calendar's script gets the day as its parameter: on dateChanged pDate. To turn that into one of xTalk's own forms of date, replace the dashes with commas and convert it from dateItems (Dates and times).
Try it yourself
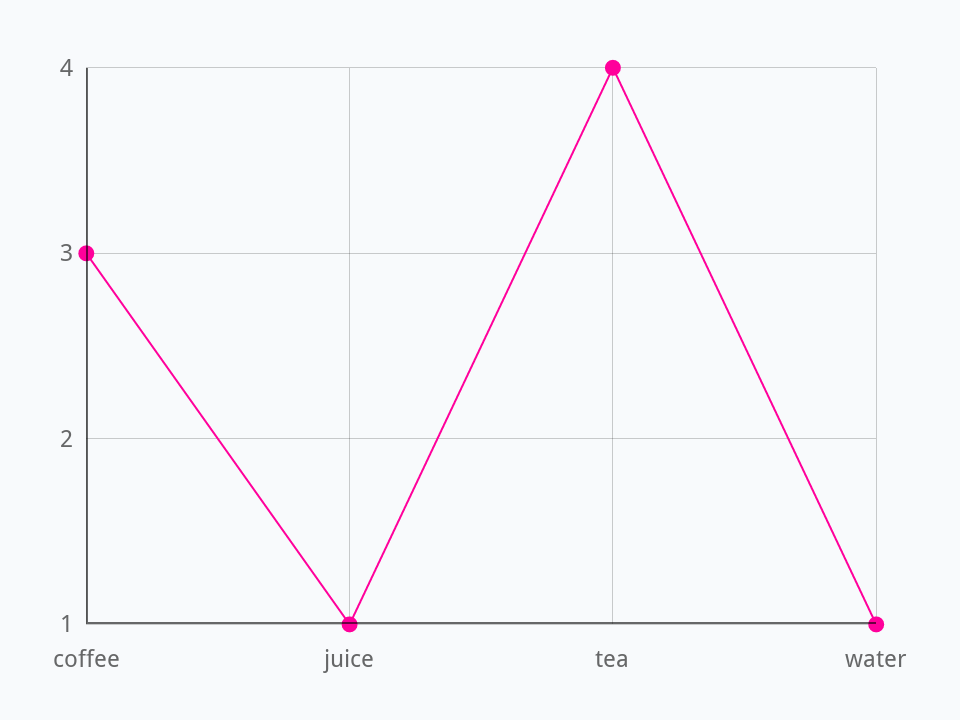
Write a function graphOf that takes an array of counts, such as how many people chose each drink, and returns graphData for a Line Graph: a line a key, in alphabetical order, each its key and its count.
Show a solution
function graphOf pCounts
   local tKeys, tKey, tData
   put the keys of pCounts into tKeys
   sort lines of tKeys
   repeat for each line tKey in tKeys
      put tKey & comma & pCounts[tKey] & return after tData
   end repeat
   return line 1 to -1 of tData
end graphOf

repeat for each word tDrink in "tea coffee tea juice coffee tea water tea coffee"
   add 1 to tCounts[tDrink]
end repeat
create widget "Drinks" as "com.livecode.widget.linegraph"
set the rect of it to 20, 20, 460, 340
set the graphData of it to graphOf(tCounts)
put the graphData of widget "Drinks"coffee,3 juice,1 tea,4 water,1
Words in this lesson
Line GraphgraphDatagraphColorsmarkerStyleshilitedCoordinatesPie ChartsectorValuessectorLabelssectorColorssectorClickedClocktimeZoneCalendarselectedDatedateChangedEach one finds every lesson that uses it. The Dictionary has the whole story of each, with its syntax and more examples.